Every electrical or digital system, from the simplest toy to the most complex supercomputer, began its life not as a tangible object, but as a series of lines and symbols on a page. These visual blueprints, known as types of circuit diagrams, are the universal language of electronics, guiding engineers, technicians, and hobbyists alike. Without them, designing, building, or even fixing a circuit would be an exercise in pure guesswork.
Think of it this way: you wouldn't try to build a house without architectural drawings, would you? Similarly, you can't truly understand or interact with an electronic system without its circuit diagram. But not all diagrams are created equal. Each type serves a distinct purpose, offering a unique perspective on the circuit's function, layout, or operation. Knowing which one to use, and how to read it, is a superpower in itself.
At a Glance: Key Takeaways
- Schematic Diagrams show how a circuit works using standardized symbols, focusing on electrical connections and component values. They're the most common type.
- Wiring Diagrams illustrate the physical layout and interconnections of components, emphasizing real-world routing and wire colors.
- Block Diagrams provide a high-level overview of a system's major functional blocks and their relationships, perfect for conceptual understanding.
- Logic Diagrams specifically detail digital circuits, representing logic gates and their Boolean operations.
- Timing Diagrams visualize the temporal relationships of signals in digital systems, crucial for understanding synchronous operations.
- Pictorial Diagrams offer a realistic visual representation of components, often used for beginners or assembly instructions.
- Mastering these diagrams empowers you to design, build, troubleshoot, and communicate effectively in the world of electronics and digital systems.
Decoding the Blueprint: Why Different Diagrams Matter
Imagine trying to explain the intricate workings of a satellite to someone using only a photograph. You'd quickly realize its limitations. You need different views—a schematic for the power system, a block diagram for data flow, a physical layout for assembly. The same principle applies to circuit diagrams. Each type strips away unnecessary information to highlight a specific aspect, making complex systems digestible and actionable.
Understanding these distinctions isn't just academic; it's intensely practical. It determines whether you can efficiently troubleshoot a faulty circuit, design a new feature, or correctly assemble a prototype. As you dive into the world of electronics, you'll find yourself reaching for different diagrams based on the task at hand. Let's explore these essential visual tools. If you're looking for a broader understanding of the field, you can always Learn about circuit diagrams from the ground up.
1. The Schematic Diagram: The Universal Language of Electronics
If there's one diagram you absolutely must know, it's the schematic. Often referred to simply as a "schematic," this is the conceptual cornerstone of circuit design. It uses standardized graphical symbols to represent electronic components and lines to show their electrical connections. It tells you what components are in the circuit and how they are connected electrically to achieve a specific function.
What It Shows You:
- Component Types: Resistors, capacitors, inductors, diodes, transistors, integrated circuits (ICs), power sources, switches, etc., all represented by their unique symbols. Learning to recognize deciphering electrical symbols is a foundational skill.
- Electrical Connections: Lines indicate wires or traces on a printed circuit board (PCB). Junctions are typically marked with a dot, while crossing lines without a dot usually imply no connection.
- Component Values: Labels next to symbols specify resistance (ohms), capacitance (farads), voltage (volts), part numbers, or other relevant parameters.
- Circuit Function: By tracing the signal path and understanding how components interact, you can deduce the circuit's purpose—e.g., an amplifier, a filter, a power supply.
When to Use a Schematic Diagram:
- Design and Development: When creating a new circuit, a schematic is your first draft. It allows you to experiment with different components and configurations.
- Troubleshooting: It's invaluable for diagnosing problems. You can trace voltages, currents, and signals to pinpoint where a malfunction occurs.
- Understanding Circuit Operation: To grasp how a circuit actually works, a schematic provides the clearest picture.
- Communication: It's the standard way engineers communicate circuit designs with each other.
How to Read It:
Reading a schematic is like reading a story. You typically start from the power input, follow the current paths, and see how components modify or process signals.
- Power Flow: Usually, power enters from the top or left. Ground (common reference) is often at the bottom.
- Input/Output: Look for designated input and output points.
- Signal Paths: Trace how signals propagate through the circuit, from one component to the next.
- Component References: Each component usually has a unique designator (e.g., R1 for resistor 1, C5 for capacitor 5, U2 for IC 2) to help locate it on a corresponding parts list or the actual PCB.
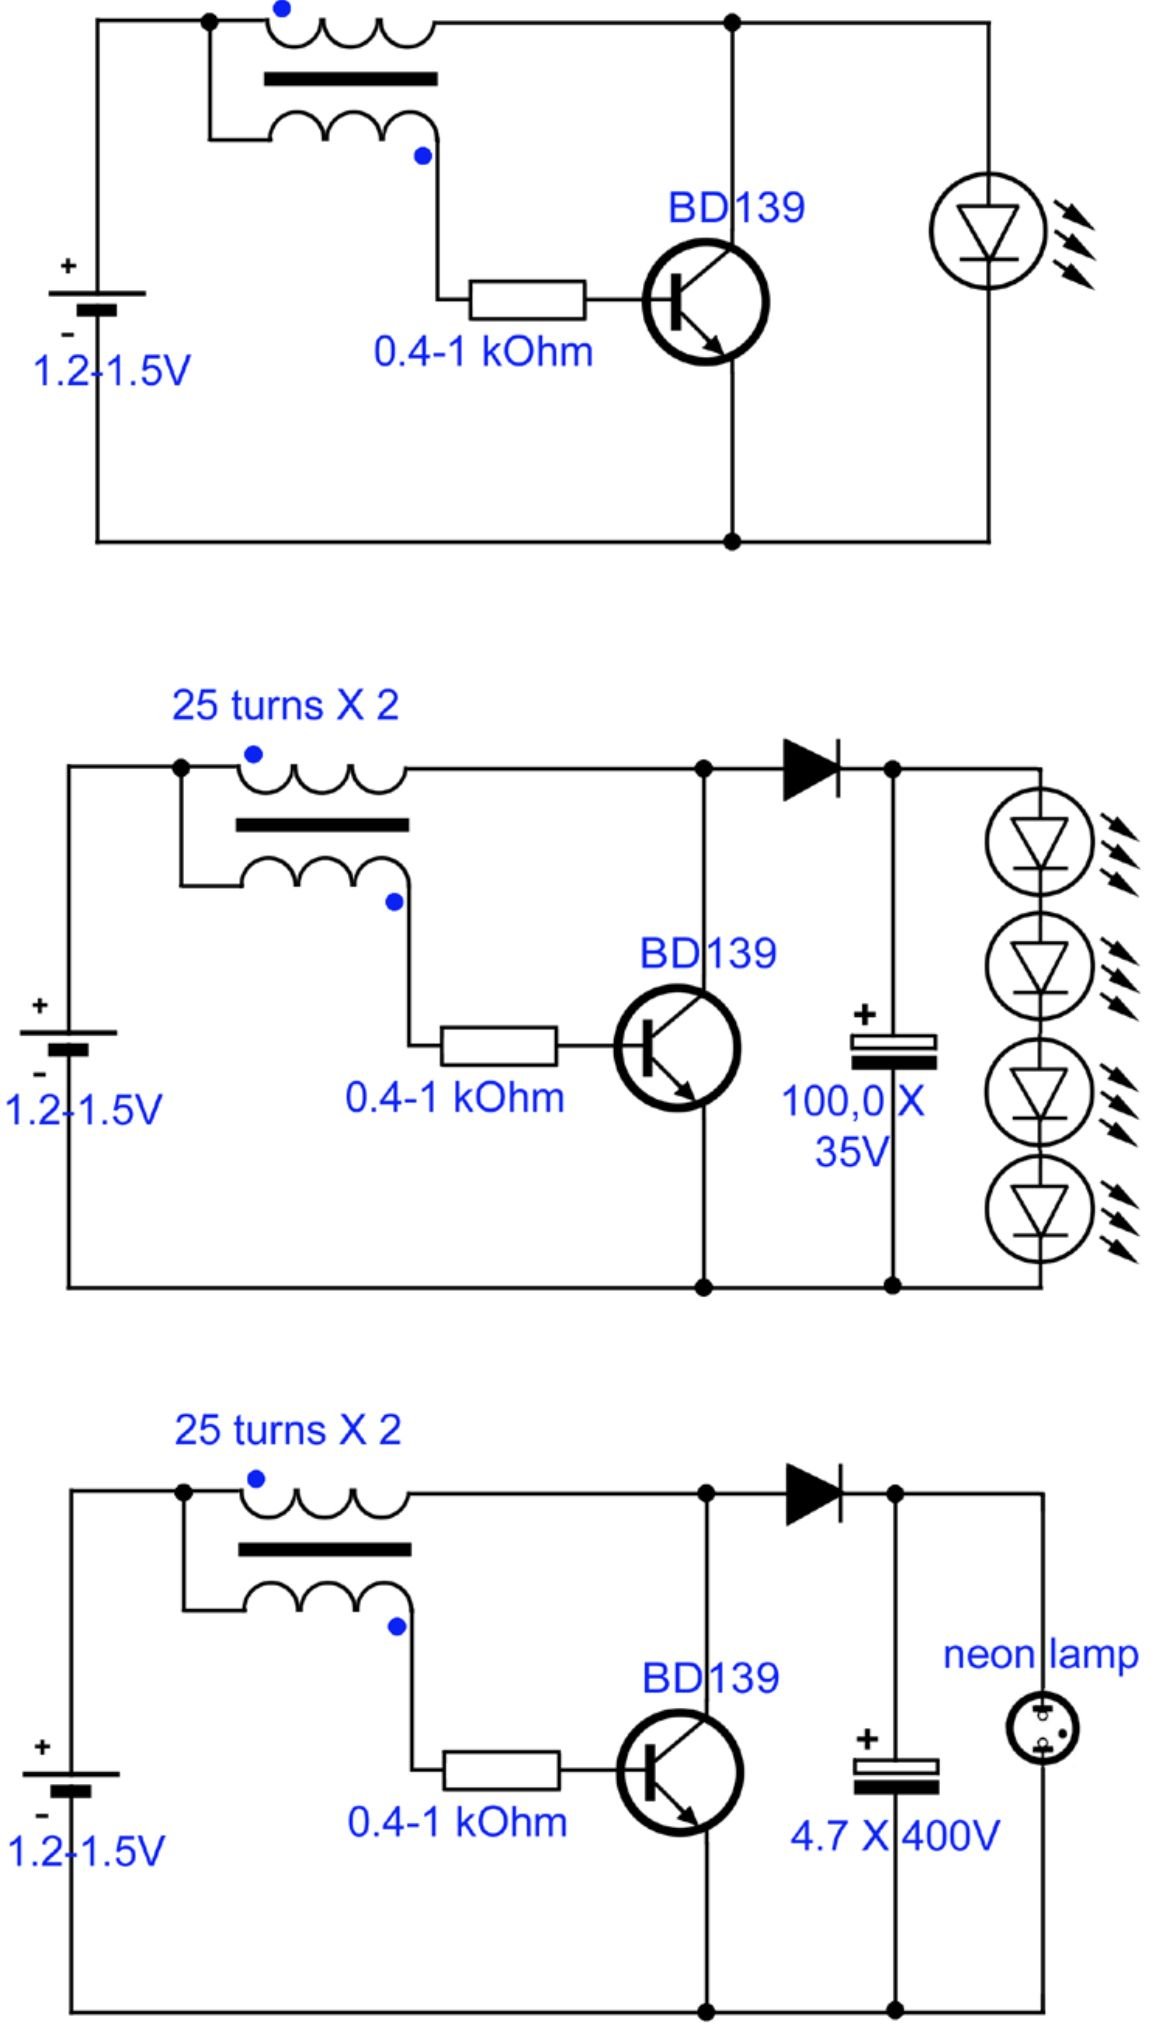
Example: A simple LED circuit would show a voltage source, a current-limiting resistor, and an LED, all connected in series. The schematic clearly illustrates this series connection and the value of the resistor needed.
2. The Wiring Diagram: Where the Rubber Meets the Road (or the Wire Meets the Terminal)
While a schematic tells you what is connected electrically, a wiring diagram tells you how it's physically connected and routed in the real world. This diagram is less about the theoretical function and more about the practical assembly.
What It Shows You:
- Physical Layout: Depicts components as they appear physically, often with realistic shapes and sizes.
- Actual Wire Runs: Shows where wires go, how they are routed, and to which terminals they connect.
- Wire Colors and Gauges: Often includes specifications for wire colors (e.g., red for positive, black for ground) and their gauge (thickness).
- Connectors and Terminal Blocks: Details specific connection points, pin numbers on connectors, and labels on terminal blocks.
- Cable Bundles: May show how individual wires are grouped into cables.
When to Use a Wiring Diagram:
- Assembly and Installation: Crucial for manufacturing, wiring up control panels, installing home automation systems, or wiring vehicles.
- Troubleshooting Physical Issues: If a connection is loose, a wire is cut, or components are incorrectly wired, this diagram helps trace the physical path.
- Maintenance and Repair: For replacing components or repairing damaged wiring in existing systems.
- Building Prototypes: When transitioning from a schematic design to a physical build, especially on breadboards or perfboards.
How to Read It:
Reading a wiring diagram is about visual matching and tracing physical paths.
- Identify Components: Match the visual representation of a component (e.g., a motor, a switch, a power supply) to its real-world counterpart.
- Trace Wires: Follow the lines representing wires from their origin to their destination, noting colors, labels, and termination points.
- Check Pinouts: Verify that wires are connected to the correct pins on connectors or terminals.
Example: In an automotive system, a wiring diagram for the headlights would show the actual headlight units, the switch on the dashboard, the fuse box, and the battery, all connected by specific colored wires routed through the vehicle's harness. It would detail which pin on the headlight connector corresponds to low beam, high beam, and ground.
3. The Block Diagram: The System's Bird's-Eye View
A block diagram provides the highest-level conceptual view of an electronic system. It breaks down a complex system into its fundamental functional units (blocks) and shows how these blocks interact and relate to one another. It focuses on what each part does and how data or power flows between them, rather than the nitty-gritty of individual components.
What It Shows You:
- Major Functional Blocks: Each block represents a distinct sub-system or function (e.g., "Power Supply," "Microcontroller," "Sensor Input," "Display Output," "Wireless Module").
- Flow of Information/Power: Arrows connecting the blocks indicate the direction of signal, data, or power flow.
- System Architecture: Gives an overall understanding of the system's structure and how its main parts contribute to the whole.
When to Use a Block Diagram:
- Conceptual Design and Planning: Ideal for the initial stages of a project to define system requirements and architecture.
- Communication with Non-Experts: Excellent for explaining complex systems to stakeholders who don't need to understand every resistor or transistor.
- High-Level Troubleshooting: Helps isolate which major sub-system might be failing before diving into detailed schematics.
- Educational Purposes: Great for introducing students to complex systems by simplifying them into manageable parts.
How to Read It:
Block diagrams are intuitive. Identify the main inputs and outputs, then follow the arrows through the functional blocks to understand the system's operation.
- Inputs/Outputs: Locate where signals or power enter and leave the system.
- Block Functions: Understand the purpose of each labeled block.
- Flow Direction: The arrows are key to understanding the sequence of operations or data processing.
Example: A block diagram for a smartphone might include blocks for "Antenna & RF Front End," "Baseband Processor," "Application Processor," "Memory," "Display," "Camera," "Battery Management," and "Audio Codec," with arrows showing how data and power move between them. It wouldn't show the hundreds of components inside the "Application Processor" block, just its overall function.
4. The Logic Diagram: Speaking the Language of Digital Gates
Logic diagrams are specific to digital electronics, where signals are typically represented by two states: high (1) or low (0). These diagrams use specialized symbols to represent fundamental digital logic gates (AND, OR, NOT, XOR, NAND, NOR) and other digital components like flip-flops, multiplexers, and decoders. They illustrate the Boolean logic operations performed by a circuit. To truly grasp these, understanding the fundamentals of digital logic is essential.
What It Shows You:
- Logic Gates: Symbols for AND gates, OR gates, NOT gates, etc., showing their inputs and outputs.
- Boolean Operations: How these gates combine to perform complex logical functions.
- Digital Data Flow: The path of digital signals (bits) through the circuit.
- Registers, Counters, Latches: Symbols for common digital building blocks.
When to Use a Logic Diagram:
- Digital Circuit Design: When designing microcontrollers, memory circuits, arithmetic logic units (ALUs), or any circuit that processes binary information.
- Understanding Digital Systems: To comprehend the decision-making and data manipulation within digital hardware.
- Debugging Digital Logic: Identifying incorrect logic or timing issues in digital systems.
How to Read It:
Reading a logic diagram involves tracing the binary inputs through the gates and determining the outputs based on the truth tables of each gate.
- Inputs/Outputs: Identify the binary inputs (usually on the left) and outputs (on the right).
- Gate Operations: Apply the rules of each logic gate (e.g., an AND gate's output is 1 only if all its inputs are 1).
- Intermediate Signals: Trace the output of one gate as it becomes an input to another.
Example: A simple logic circuit for a security system might use an AND gate. If input A (door sensor active) is high AND input B (window sensor active) is high, then the output (alarm) goes high. The logic diagram would show these inputs feeding into an AND gate symbol, with an output line labeled "Alarm."
5. The Timing Diagram: The Dance of Signals Over Time
Where logic diagrams show what operations occur, timing diagrams show when they occur. These are crucial for digital systems, especially those operating synchronously (clock-driven) or with precise timing requirements. A timing diagram is essentially a graph that plots the logical state (high/low) of multiple digital signals against a common time axis.
What It Shows You:
- Signal Transitions: When a signal changes from low to high or high to low.
- Timing Relationships: The delays, setup times, hold times, and propagation times between different signals.
- Clock Cycles: How signals relate to the system clock.
- Concurrency: Which signals are active or inactive at specific moments.
When to Use a Timing Diagram:
- Synchronous Digital Design: Verifying that data arrives at registers and flip-flops at the correct time relative to a clock edge.
- Interfacing Digital Devices: Ensuring that communication protocols (like SPI, I2C, UART) between chips are met.
- High-Speed System Design: Analyzing race conditions or glitches that can occur due to signal propagation delays.
- Debugging Digital Hardware: Pinpointing the exact moment a signal goes wrong, which can be critical for common circuit troubleshooting techniques in digital systems.
How to Read It:
You read a timing diagram by moving from left to right along the time axis, observing the state changes of each signal.
- Time Axis: Horizontal axis, usually marked with clock cycles or specific time units.
- Signal Lines: Vertical axis, each line representing a specific digital signal (e.g., Clock, Data, Enable).
- High/Low States: The waveform for each signal shows its logical state (high or low) at any given time.
- Edges: Rising (low to high) and falling (high to low) edges are significant, especially in synchronous circuits.
Example: A timing diagram for a simple data transfer might show a "Clock" signal toggling, a "Data_In" signal changing its value, and a "Load_Enable" signal going high for a specific duration, all aligned to ensure the data is captured correctly by a flip-flop on a rising clock edge.
6. The Pictorial Diagram: Visually Connecting the Dots
Less common in professional engineering but immensely helpful for beginners, hobbyists, and assembly instructions, pictorial diagrams show components as they would appear in real life. These diagrams prioritize visual clarity over symbolic abstraction, making it easier to identify parts and their physical connections.
What It Shows You:
- Realistic Component Images: Actual photographs or detailed drawings of resistors, capacitors, ICs, and other parts.
- Physical Connections: Lines often represent wires, showing their actual paths and termination points, similar to a simplified wiring diagram.
- Board Layouts: May show components placed on a breadboard or a simple PCB.
When to Use a Pictorial Diagram:
- Beginner Kits and Tutorials: Ideal for someone learning to solder or build their first circuit without prior knowledge of schematic symbols.
- Assembly Instructions: When manufacturing or assembling a product where visual guidance is more intuitive than abstract symbols.
- Simple Projects: For quick builds where detailed schematics are overkill.
How to Read It:
Simply identify the components by their appearance and follow the connecting lines. It's the most straightforward diagram to interpret visually.
Example: A pictorial diagram for assembling a small robot kit might show an actual picture of a motor, an H-bridge motor driver chip, and a microcontroller, with colorful lines indicating where each motor wire connects to the driver, and where the driver connects to the microcontroller.
Beyond the Basics: Other Specialized Diagrams
While the types above cover the vast majority of needs, you might encounter other specialized diagrams depending on your field:
One-Line Diagram (Single-Line Diagram): Power System Simplicity
Primarily used in power engineering, a one-line diagram simplifies complex three-phase power systems into a single line representing all three phases. It uses specialized symbols for generators, transformers, circuit breakers, and bus bars. This diagram is crucial for visualizing the overall structure of a power grid or industrial electrical system and understanding power flow and protection. They are fundamental when dealing with power distribution systems.
Functional Block Diagram (Control Systems): Process Flow and Feedback
Often seen in control systems engineering, these diagrams use blocks to represent functions (like a PID controller, a sensor, an actuator) and arrows to show the flow of signals, often including feedback loops. They are excellent for analyzing system stability and performance.
PCB Layout Diagram: The Physical Board Itself
Once a schematic is finalized, the next step in many projects is designing a Printed Circuit Board (PCB). A PCB layout diagram (or simply "layout") shows the physical arrangement of components on the board, the copper traces connecting them, and other features like vias, pads, and silkscreen labels. This is critical for manufacturing and understanding the physical implementation of the circuit. A solid understanding of the basics of PCB design often starts here.
Pitfalls to Avoid When Working with Diagrams
- Mixing Types: Don't try to use a schematic diagram for physical wiring instructions or a wiring diagram for functional analysis. Use the right tool for the job.
- Outdated Diagrams: Circuits evolve. Always ensure you're working with the most current version of a diagram.
- Ignoring Conventions: Stick to established symbols, naming conventions, and flow directions. Consistency is key for clarity.
- Over-reliance on Experience: Even experienced engineers refer to diagrams. Don't assume you remember everything; always double-check.
- Not Annotating: If you make changes or find errors, mark them on a copy of the diagram immediately.
Becoming a Diagram Whisperer: Your Next Steps
The ability to read, interpret, and even sketch different types of circuit diagrams is one of the most fundamental skills in electrical and digital system design. It's not just about understanding individual components; it's about seeing the whole system, anticipating its behavior, and diagnosing its ailments.
Here's how you can sharpen your skills:
- Start with Schematics: They are the foundation. Practice reading simple circuits, identifying components, and tracing signal paths.
- Build Simple Circuits: Translate a schematic to a breadboard. This hands-on experience will solidify your understanding of how symbols relate to physical parts.
- Study Real-World Examples: Find schematics and wiring diagrams for appliances, open-source projects, or development boards you own.
- Try Sketching: Draw simple circuits yourself. Start with a block diagram, then translate it into a schematic, and finally imagine its wiring layout.
- Ask Questions: If a symbol or connection confuses you, look it up or ask someone knowledgeable.
Whether you're an aspiring engineer, a seasoned technician, or a curious hobbyist, mastering the various types of circuit diagrams will unlock a deeper understanding of the electronic world around you. It's the key to turning abstract concepts into tangible realities, and a skill that will serve you throughout your journey in electronics.